Instrument Inspector
ChromaChecker™ Instrument Inspector
Examines virtually any spectrophotometer
- evaluate your spectrophotometer accuracy
- checks if you can trust your measurements – otherwise factory recertification must be done immediately
- compare results from different instruments
- compare your spectrophotometer with other users
- see visualization of measurements and differences – try to understand problem if appear
- report for quality control procedures (ISO 9001)
- works with Instrument Inspector Target and other targets
- learn how to use your instrument to improve its accuracy
- learn about the real instrument's pros and cons
How does it work?
When you start working with ChromaChecker™ Instrument Inspector you need to have reference data – in other words you need to know how your instrument measures color. For that purpose Instrument Inspector Target  consist of 42 color patches to control accuracy and repeatability. Several initial measurements are used to create Baseline – averaged data used as a reference point for all future analysis.
Once you have a Target and your customized Baseline data, you can re-measure the target at any time and compare the measurement data with the baseline data. If the difference between the baseline and the measured data is small, then you will know that your instrument is still accurate to your tolerances (tolerances are customizable).
Easy Mode
For routine measurement one step operation can validate your instrument.
Measure Instrument Inspector Target and upload results to ChromaChecker™ server. Current measurement will apear on the top of the list. The Pass/Fail will automatically compare some basic numbers with selected class of tolerances. In Easy Mode following parameters are taking into account:
- Max ?E,
- CRF for 95%
- CRF for 90%,
- Mean ?E,
- Standard deviation
Additionally four worst patches are presented graphicaly, but for instrument operator the most important is presence of PASS mark: 
If so, no other action is required.
When FAIL  mark appears, it means that there is a problem and it needs to be fixed before capturing new data.
Sample Easy Mode page:
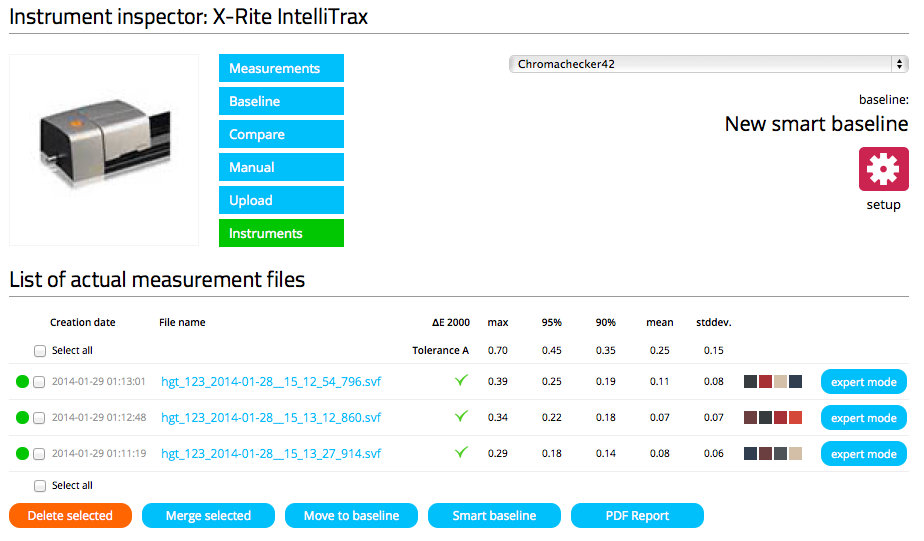
Easy Mode offers PDF reporting for selected measurement files – this is usefull for ISO 9001 documentation purposes.
Expert Mode
Expert mode delivers extended analysis. Several parts of detailed report gives a lot of information about results. Data is divided into different measurement conditions that can be evaluate over time, and compared between different instrument baselines.
Expert mode offers:
- ?E timeline
- CIE Lab values and ?E (user selectable formulas), ?C, ?H, ?L
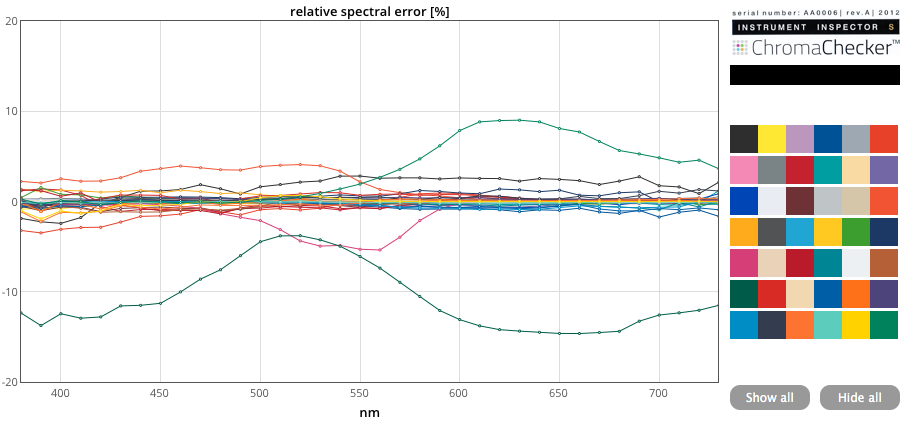
- Spectral data graph, Spectral absolute and relative errors graphs
- Maps of trend errors – this unique feature helps to recognize source of potential issue (dirty filters, different energy sources)
- Metamerism and Fluorescent Indexes
- File info and sharing feature (public link for selected file)
SAMPLE EXPERT MODE REPORTS (selection):
Deltas Timeline
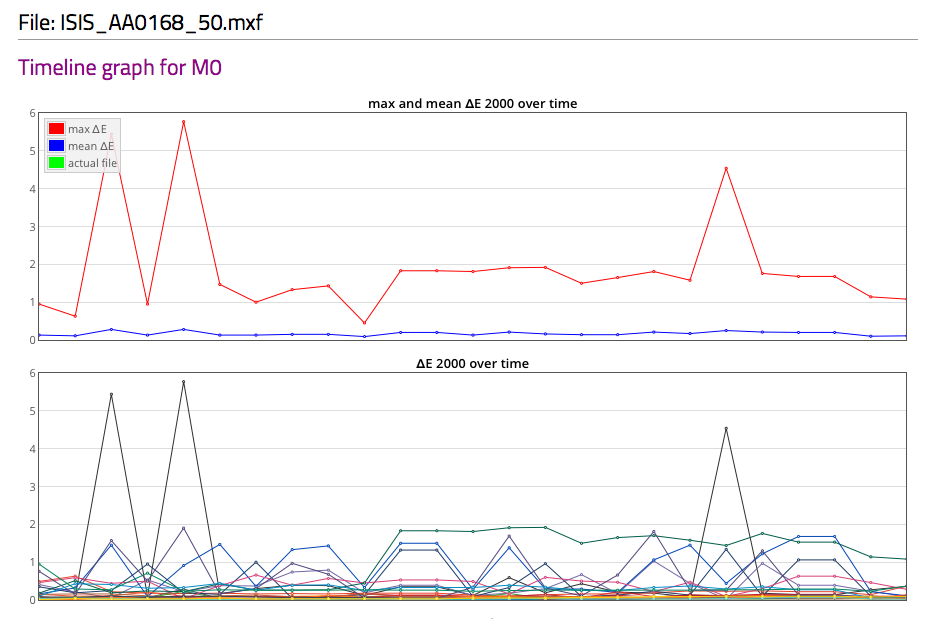
Graph shows problems of black and other dark patches reading
Relative Spectral Error Graph:
Spectral Error Trend Map:
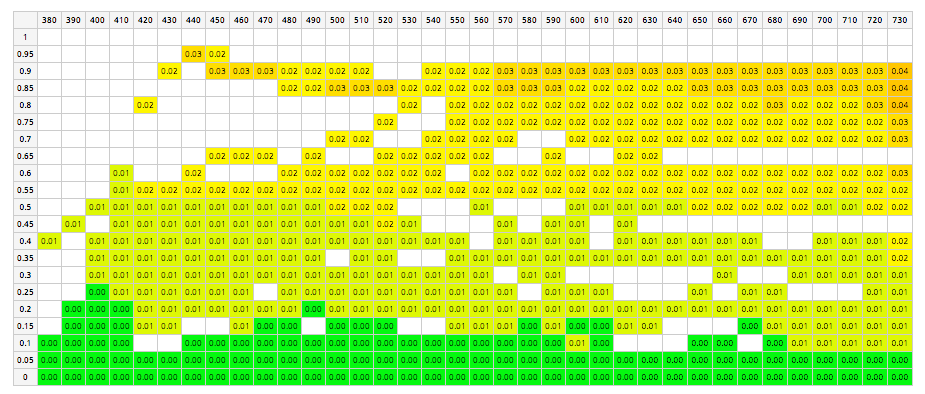
Graph shows known issue of unstable source of radiation buit into instrument.
Instrument comparison
It is possible to compare up to 5 instruments / baselines. Go to compare menu, select baselines to compare.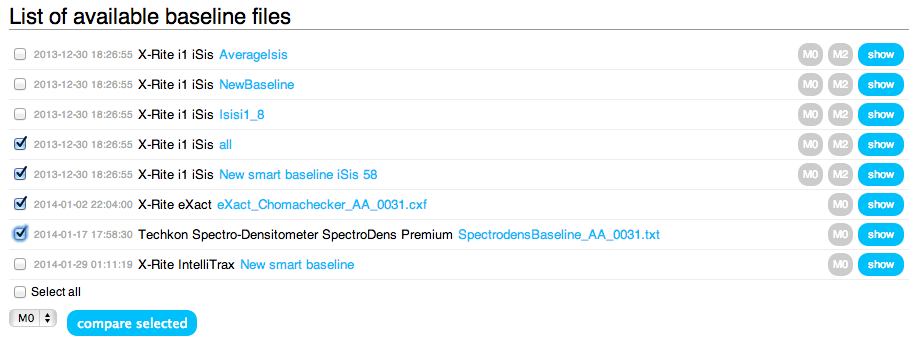
By pressing the button cross comparision of each combination will be displayed:
Easy mode results are presented. Select interesting combination / matix cell to enter Expert Mode.
Only baselines can be compared. Any meaurement file or averaged data (merge function) can be moved to baseline directory any time.
How to start?
Every time if you need more information about your instrument you can enter Expert Mode which provide detailed information.
- To start you need Instrument Inspector Target . To order it contact David Hunter: david@chromachecker.com
- Download softare settings for your specific target version / instrument / data capturing software.
- Define your instrument and register target on your ChromaChecker™ user account.
- Make series of measurements of your target (10-30). You can observe that some instruments may drift with repeated measurements.
- Using "Smart Baseline" button make a Baseline – your customised reference for future evaluation.
Smart baseline feature has built-in optimizing algorithm for best data averaging.
Instrument and software compatibility list
For inter user data exchange, users community data averaging and to avoid errors generated by the data capture software we strongly recommend to use settings listed bellow (check this list for updates):
| INSTRUMENT / VENDOR | DATA CAPTURE SOFTWARE | HOW TO/TARGET/SETTINGS | FILE | XRGA | NOTES | |
|---|---|---|---|---|---|---|
| X-Rite i1Pro 1 | X-Rite i1 Profiler 1.5 | X-42, U-42 |
CxF | + | ||
| X-Rite i1Pro 1 UV cut | X-Rite i1 Profiler 1.5 | X-42, U-42 |
CxF | + | ||
| X-Rite iSis , iSis XL | X-Rite i1 Profiler 1.5 | X-42  , U-42 , U-42 |
CxF *1 | + | ||
| X-Rite i1Pro 2 | X-Rite i1 Profiler 1,5 | X-42 , U-42 |
CxF *1 | + | ||
| X-Rite i1iO 1 generation | X-Rite i1 Profiler 1.5 | |
CxF | + | ||
| X-Rite i1iO 2 generation | X-Rite i1 Profiler 1.5 | |
CxF *1 | + | ||
| X-Rite Intelitrax | X-Rite Intellitrax Manage 1.7*3 | ITX-42 |
SVF | + | ||
| X-Rite Exact | X-Rite Exact Manager | X-42 / U-42 / ITX-42 |
CxF *1 | + | manual mode | |
| X-Rite 530 | X-Rite ColorPort 2.0 | X-42 / U-42 |
txt (CGATS.17) | + | manual mode | |
| X-Rite 939 | X-Rite ColorPort 2.0 | X-42 / U-42 |
txt (CGATS.17) | + | manual mode | |
| X-Rite SpectroEye | X-Rite ColorPort 2.0 | X-42 / U-42 |
txt (CGATS.17) | + | manual mode | |
| X-Rite DTP-70 | X-Rite ColorPort 2.0 | |
txt (CGATS.17) | + | manual mode | |
| Techkon SpectroDens Advanced / Premium | Techkon Spectro Connect 2.4 | X-42 / U-42 / ITX-42 |
txt *2 | manual mode | ||
| Techkon SpectroJet / SpectroDrive | Techkon Spectro Connect 2.4 | available soon | ||||
| Barbieri LFP / Barbieri Swing | Barbieri Gateway 4.3 | X-42 / U-42 |
||||
*1 Multiple measuring conditions in a single file (e.g. M0, M1, M2)
*2 Optional averaging feature
*3 Software in version 1.6 or 1.7 enables XRGA compatibility (strongly recomended), older versions are X-Rite Legacy. In the section labeled
“Data Transformation” there is an "Enable XRGA" check box – This needs to be checked.
We have attempted to control the applications that can build measurement data to upload into the ChromaChecker™ system. Ideally, you want to use the software product that you routinely use to capture your measurement data (because the software can greatly influence how the instrument measures color). If your software is not listed here, please list the specific version of the measurement instrument with the specific version of the software and email to david@chromachecker.com for potential addition to the ChromaChecker™ product.
